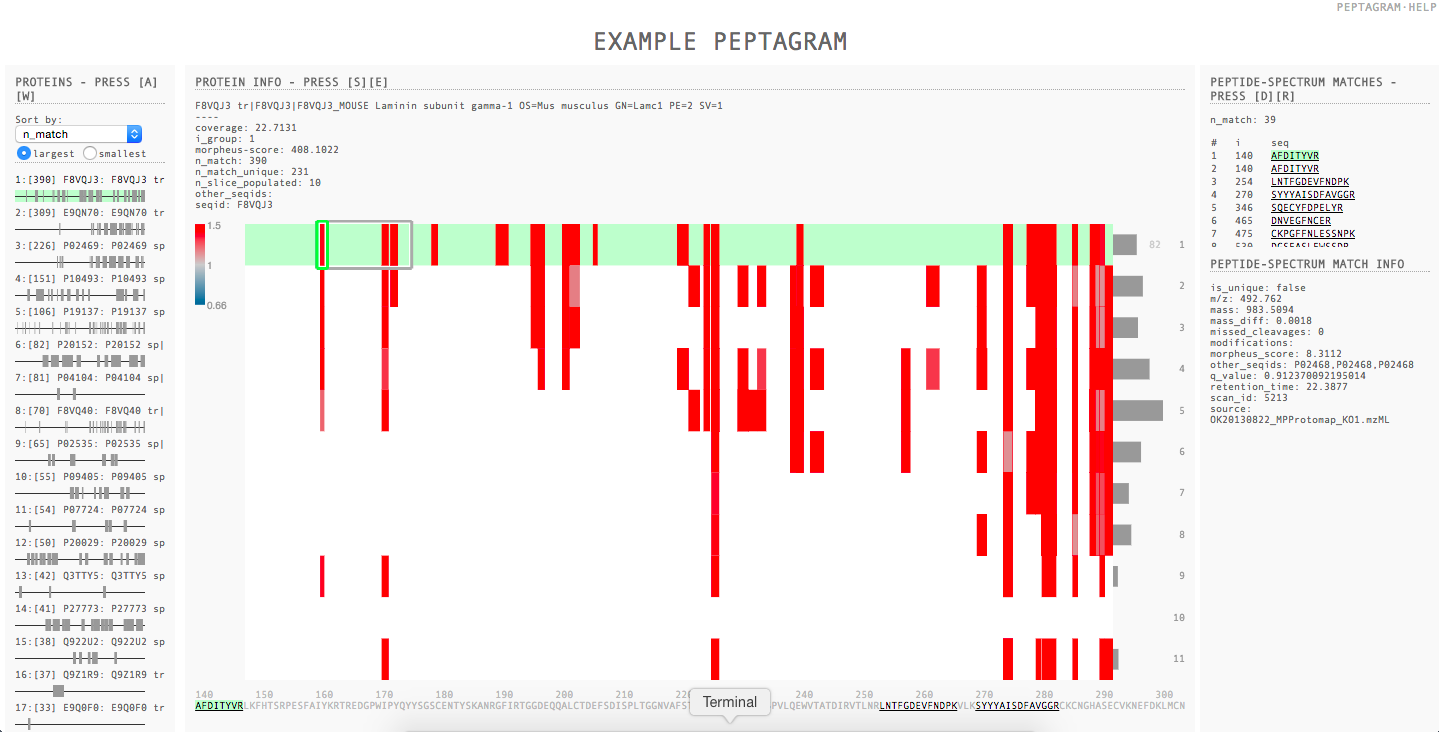
peptagram visualizes the comparison of peptide coverage across proteomics experiments.
It even lets you compare peptides from different search engines.
The visualization is generated as an HTML5 visualization, which is:
If you would rather examine spectra in detail, try peptide-shaker or PepXMLViewer.
peptagram consists of a set of python scripts that converts proteomics data into an HTML5 visualisation (Chrome, Safari, Firefox).
peptagram requries python 2.7. If your system does not have it, you should download python.
Download and unzip the package from https://github.com/boscoh/peptagram/archive/master.zip.
For developers: to use peptagram as a python module, you should:
> pip install peptagram
Or download the package and run:
> python setup.py install
peptagram has two python dependencies:
.mzML filesTo install them with the python package installer pip:
> pip install pymzml uniprot
Visualization Generation - describes how to generate peptagrams.
Visualization Help - describes all the features of a peptagram.
Programming API - describes how to automate the generation of peptagrams and how to develop your own parsers for it.